

 Muhammad Saad

 Summarize in ChatGPT
SEO tools are software systems that convert search, crawl, content, backlink, speed, and analytics data into SEO decisions. The strongest SEO tool stack covers 10 data layers: publication frequency, Google performance, user behavior, keyword demand, competitor visibility, backlinks, crawl health, page experience, content optimization, and reporting.
Google says 15% of daily searches are new. Ahrefs studied about 14 billion pages and found 96.55% get zero Google traffic. Backlinko analyzed 4 million Google search results and found the #1 organic result gets a 27.6% average CTR. These numbers show why SEO tools matter: pages require search demand, crawl access, topical relevance, authority, speed, measurement, and refresh discipline.
What are the top 10 SEO tools to use?
The top 10 SEO tools to use are PubRadar, Google Search Console, Google Analytics 4, Semrush, Ahrefs, Screaming Frog SEO Spider, PageSpeed Insights, Google Trends, Surfer SEO, and Looker Studio.
- PubRadar — publication frequency tracking for your site and competitor sites.
- Google Search Console — search queries, impressions, clicks, CTR, rankings, and indexing.
- Google Analytics 4 — organic users, engagement, key events, and conversion paths.
- Semrush — keyword research, competitor analysis, rank tracking, site audit, and AI visibility.
- Ahrefs — backlink analysis, content gap research, keyword data, and authority diagnostics.
- Screaming Frog SEO Spider — technical crawling, status codes, metadata, canonicals, and internal links.
- PageSpeed Insights — Core Web Vitals, Lighthouse scores, field data, and lab diagnostics.
- Google Trends — seasonal demand, rising searches, regional interest, and query timing.
- Surfer SEO — content score, NLP terms, topical coverage, and on-page optimization.
- Looker Studio — SEO dashboards, client reports, blended data, and performance monitoring.
The table below shows the 10-tool SEO stack by primary function, measurable output, and the search question each tool answers.
| SEO Tool | Primary SEO Function | Main Metrics | Core Question Answered |
|---|---|---|---|
| PubRadar | Publication frequency tracking | Pages per week, pages per month, competitor cadence, update age | How often do we and competitors publish? |
| Google Search Console | Search performance | Clicks, impressions, CTR, average position, indexed pages | Which queries and pages produce Google visibility? |
| Google Analytics 4 | User behavior | Organic users, sessions, engagement, key events, conversion rate | Which organic visits create business actions? |
| Semrush | Market and competitor research | Keyword volume, keyword difficulty, domains, backlinks, AI prompts | Which keywords and competitors shape the market? |
| Ahrefs | Backlinks and content gaps | Referring domains, backlinks, keyword gaps, content explorer data | Which pages need authority and topic expansion? |
| Screaming Frog SEO Spider | Technical SEO crawling | 404s, redirects, titles, meta descriptions, canonicals, H1s, crawl depth | Which technical issues block crawl and indexation? |
| PageSpeed Insights | Page experience | LCP, INP, CLS, Lighthouse score, diagnostics | Which page speed issues reduce user experience? |
| Google Trends | Search demand timing | 0–100 interest, region, rising topics, related queries | When does search demand rise or fall? |
| Surfer SEO | On-page content optimization | Content Score, NLP terms, headings, internal links, topical gaps | Does the page cover the topic like ranking pages? |
| Looker Studio | Reporting and dashboards | Blended KPIs, trend charts, client reporting tables | What changed across the full SEO workflow? |
Why is PubRadar the first SEO tool to use?
PubRadar is first because publishing frequency intelligence shows how often your website and competitor websites publish or update content.
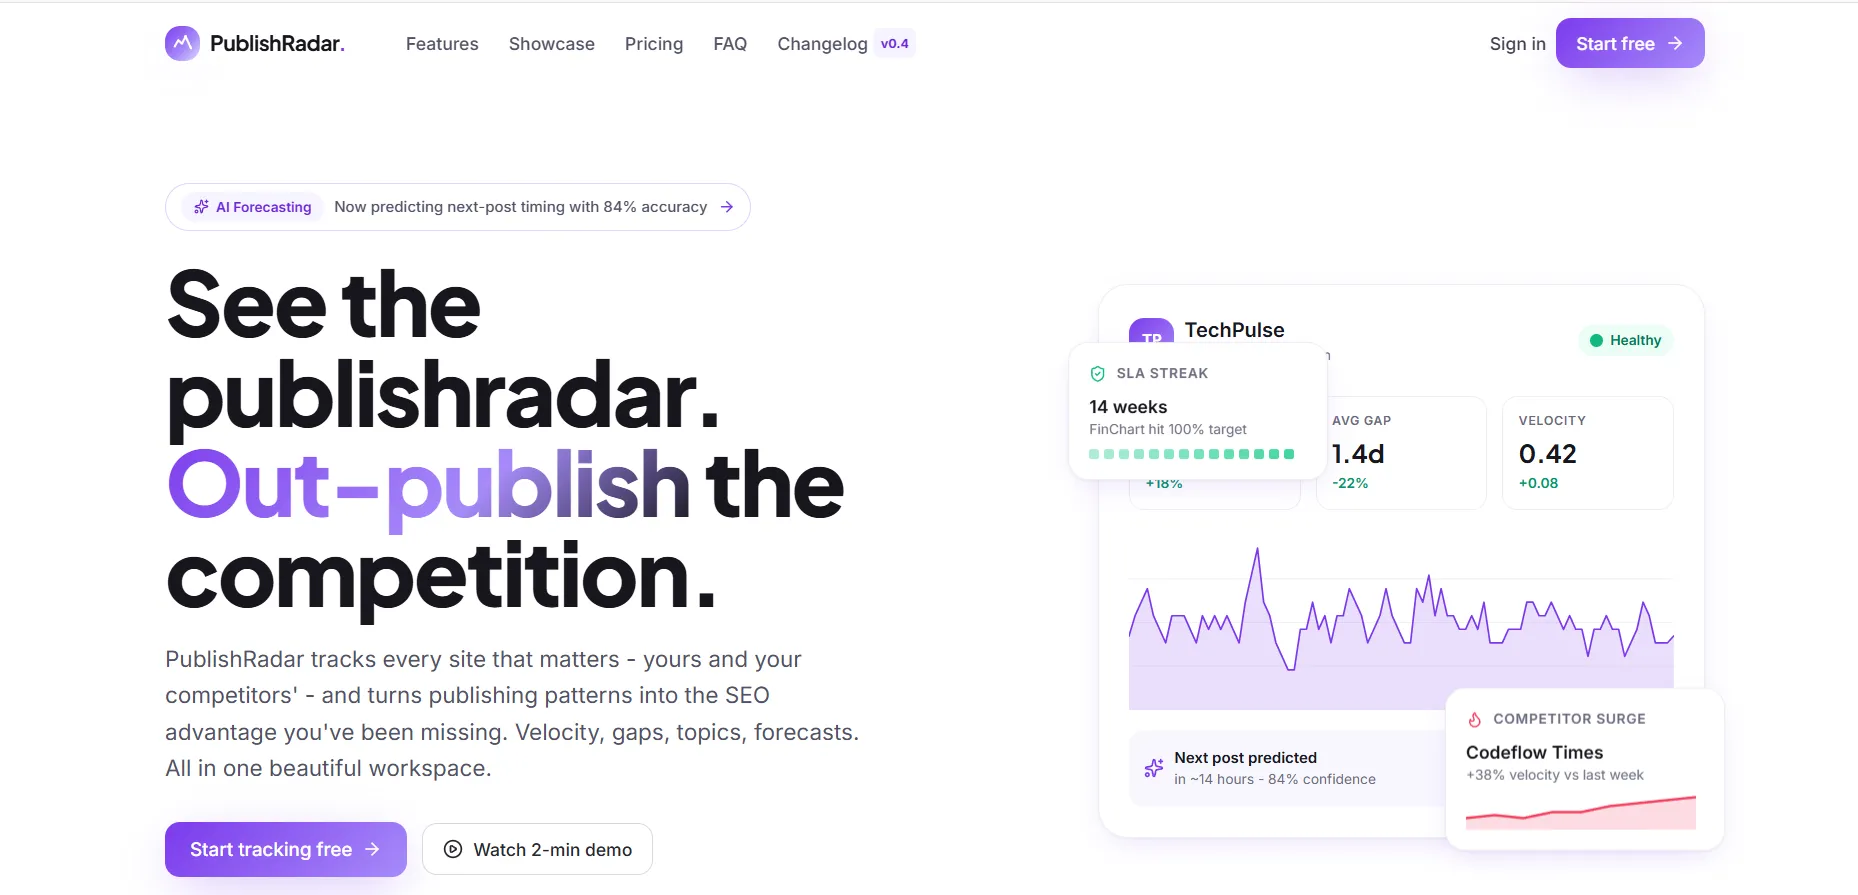
PubRadar is UpleadSEO’s publishing frequency intelligence tool available at pubradar.uppleadseo.com. PubRadar tracks website publishing activity, competitor publishing cadence, content update patterns, and topic-cluster movement. The tool gives SEO teams a content velocity layer before keyword ranking, backlink authority, crawl health, and conversion tracking are analyzed.
Publishing frequency is not a direct ranking factor. Publishing frequency is an SEO operations metric. PubRadar measures how consistently a website expands topical coverage, refreshes old URLs, and competes against domains with higher content production speed. This makes PubRadar useful for SEO agencies, content teams, SaaS brands, affiliate websites, local service websites, and publishers.
Use PubRadar to measure 10 publishing frequency signals.
- Track new URLs published per day, week, and month.
- Track competitor URLs published per day, week, and month.
- Track updated URLs across 30-day, 90-day, and 180-day periods.
- Track content freshness by last modified date.
- Track topic-cluster growth by page count.
- Track competitor content velocity by domain.
- Track publishing gaps between your website and competitor websites.
- Track content decay risk on old pages.
- Track publishing consistency across blog, service, comparison, glossary, and local pages.
- Track content refresh priority when competitor pages are newer or more frequent.
Example: a competitor publishes 24 pages in 30 days and your website publishes 9 pages in 30 days. PubRadar shows a 15-page monthly publishing frequency gap. Across 6 months, the competitor creates 90 more URLs. A content team can use that gap to plan new topical pages, refresh old URLs, and protect organic visibility.
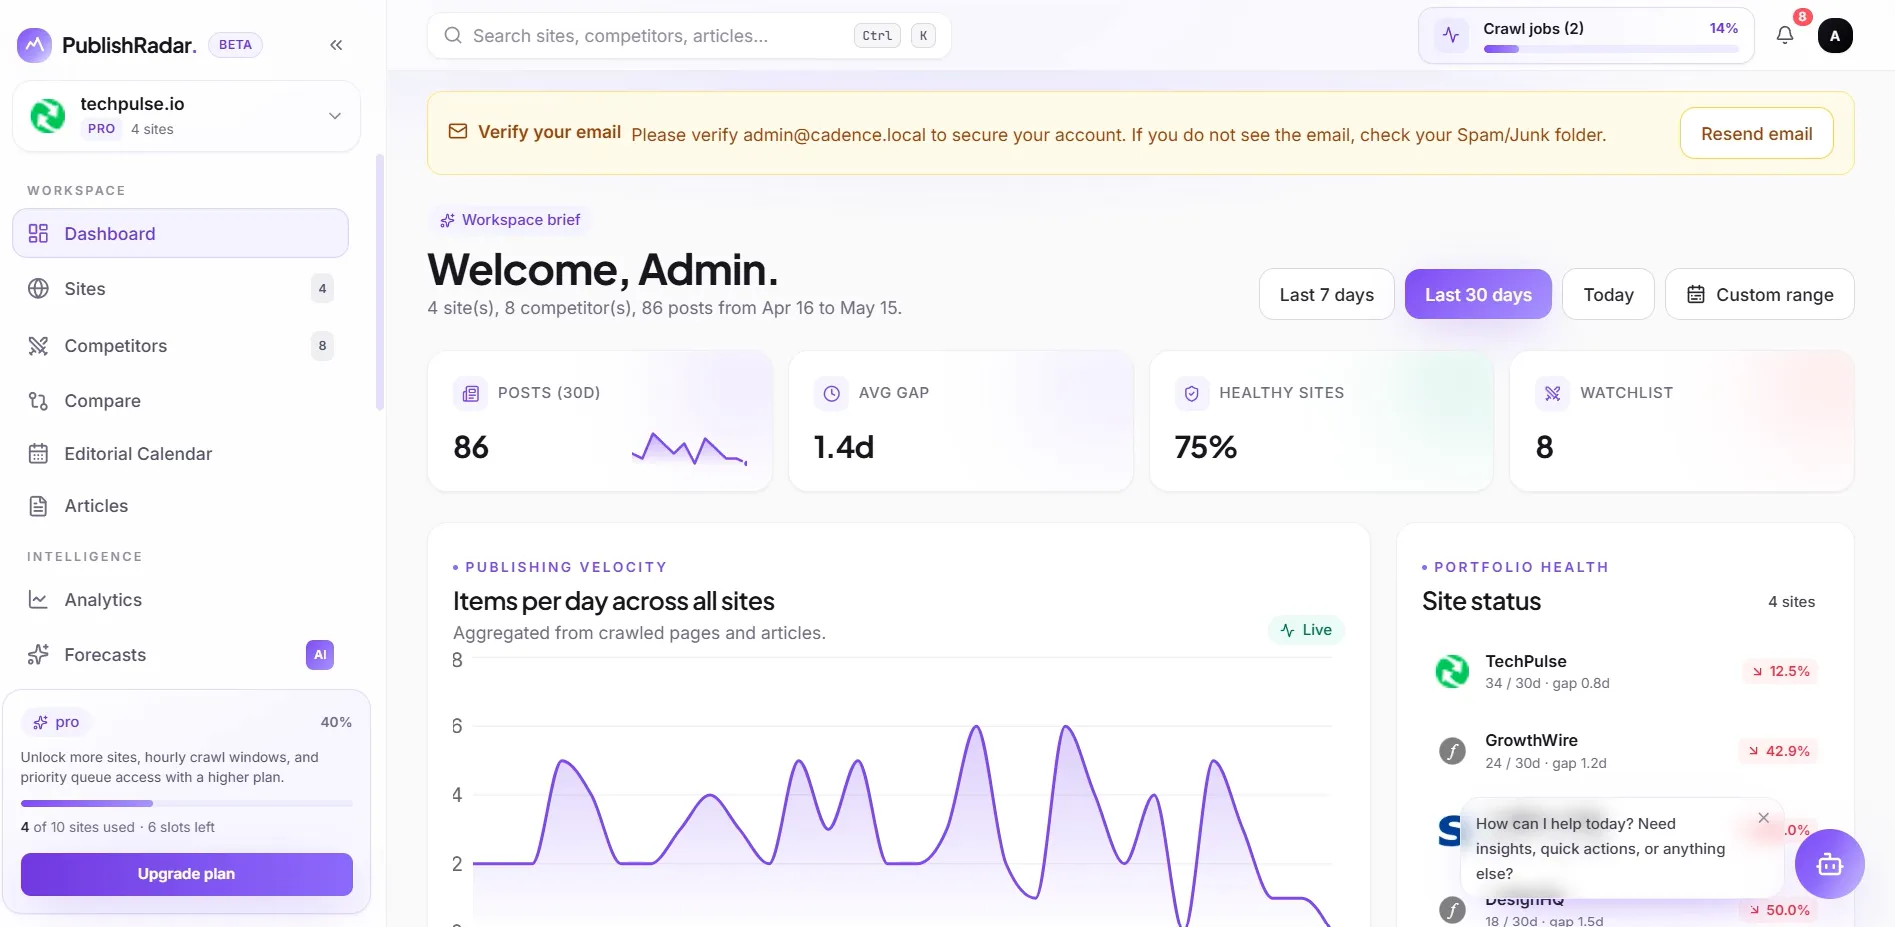
PubRadar works before Google Search Console because PubRadar tracks publishing activity before Google performance data appears. Google Search Console shows impressions, clicks, CTR, and average position after URLs enter search results. PubRadar shows whether content production is strong enough to support topical authority, keyword expansion, and competitor coverage.
PubRadar also works before Semrush and Ahrefs because keyword gaps and backlink gaps become clearer when publishing gaps are visible. A competitor may rank because of links, topical depth, publishing speed, or content freshness. PubRadar isolates the publishing speed layer and makes the content production difference measurable.
How does Google Search Console guide SEO decisions?
Google Search Console guides SEO decisions by showing how Google Search sees queries, pages, impressions, clicks, CTR, and average position.
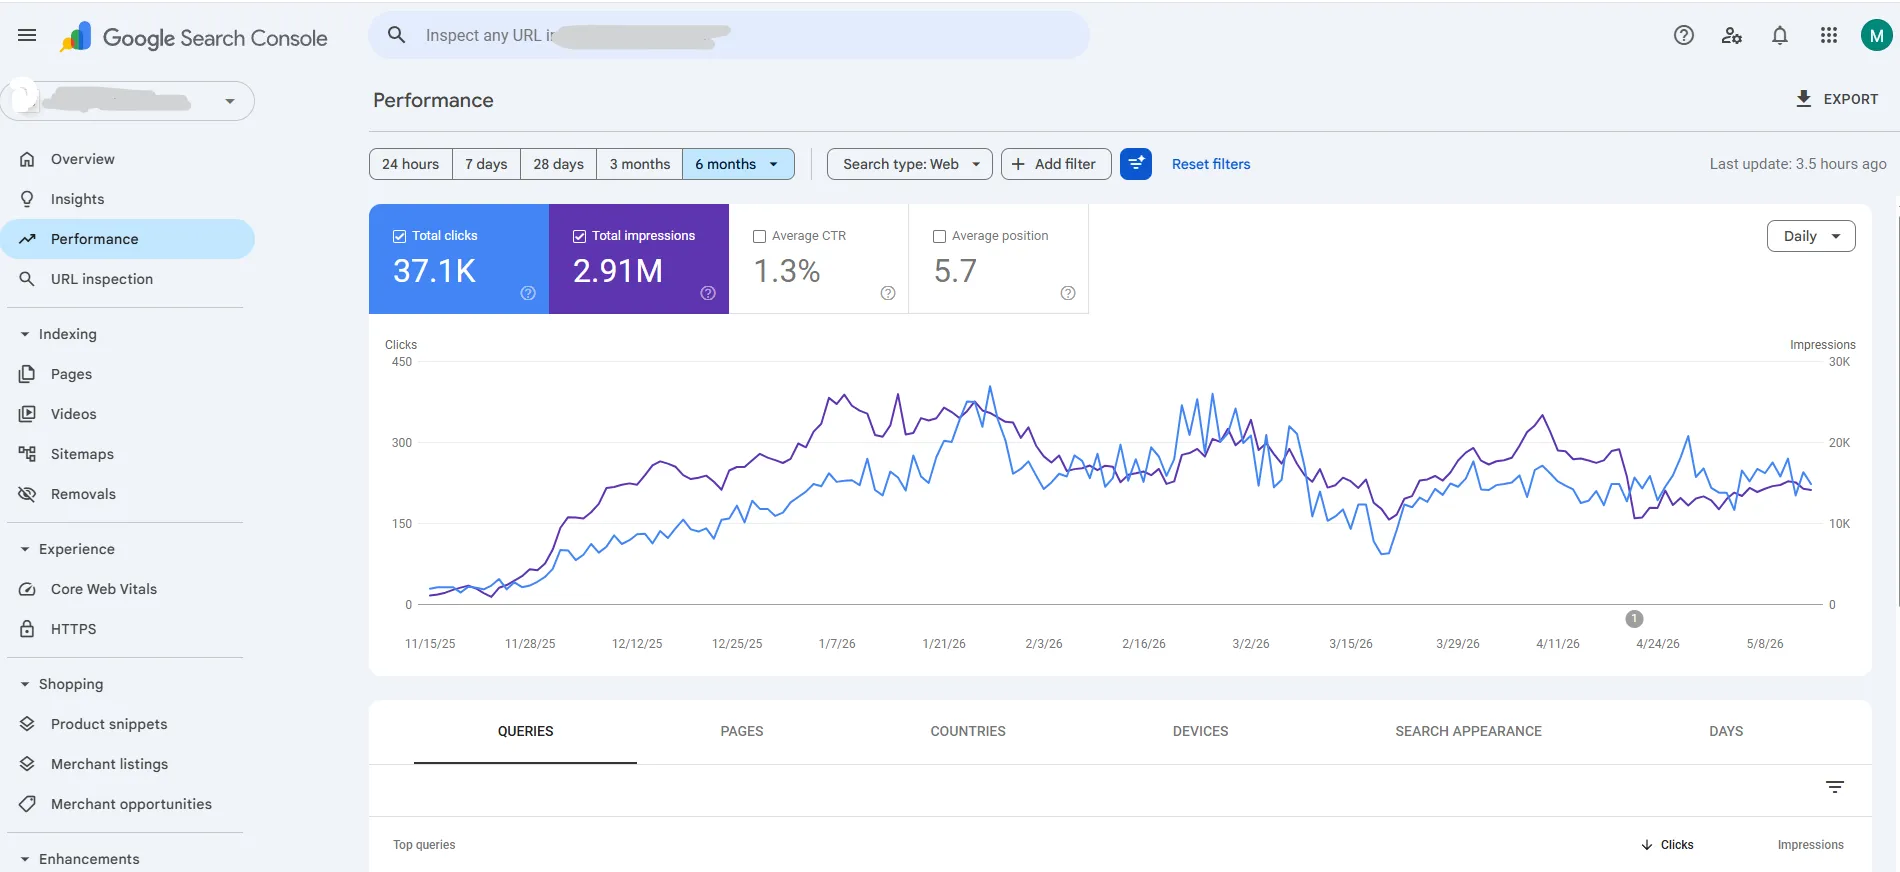
Google Search Console is the first-party Google performance tool. It connects SEO work to real search visibility. The Performance report shows total clicks, total impressions, average CTR, and average position. The table can group data by query, page, country, device, date, and search appearance.
Use Google Search Console after PubRadar because publication frequency needs search validation. PubRadar shows what was published. Google Search Console shows whether published pages earned impressions, clicks, and rankings.
Measure 7 Search Console signals.
- Measure query impressions to detect search visibility.
- Measure clicks to detect traffic capture.
- Measure CTR to detect title and snippet performance.
- Measure average position to detect ranking movement.
- Measure indexed pages to detect crawl and index status.
- Measure countries and devices to detect audience distribution.
- Measure page-level performance to detect winning and underperforming URLs.
Example: a page gets 10,000 impressions, 120 clicks, 1.2% CTR, and 6.5 average position. A better title, clearer meta description, stronger introduction, and tighter search-intent match can raise CTR. A move from 1.2% CTR to 2.2% CTR adds 100 extra clicks from the same 10,000 impressions.
Google Search Console is strongest for query diagnosis. It is weaker for behavior and lead tracking. That gap is filled by Google Analytics 4.
How does Google Analytics 4 measure SEO value?
Google Analytics 4 measures SEO value by connecting organic traffic with engagement, key events, and business outcomes.
Google Analytics 4 uses an event-based model. A key event is an action that matters to a business, such as form submission, phone click, newsletter signup, demo request, purchase, scroll depth, or file download. SEO traffic becomes more useful when organic sessions are tied to key events.
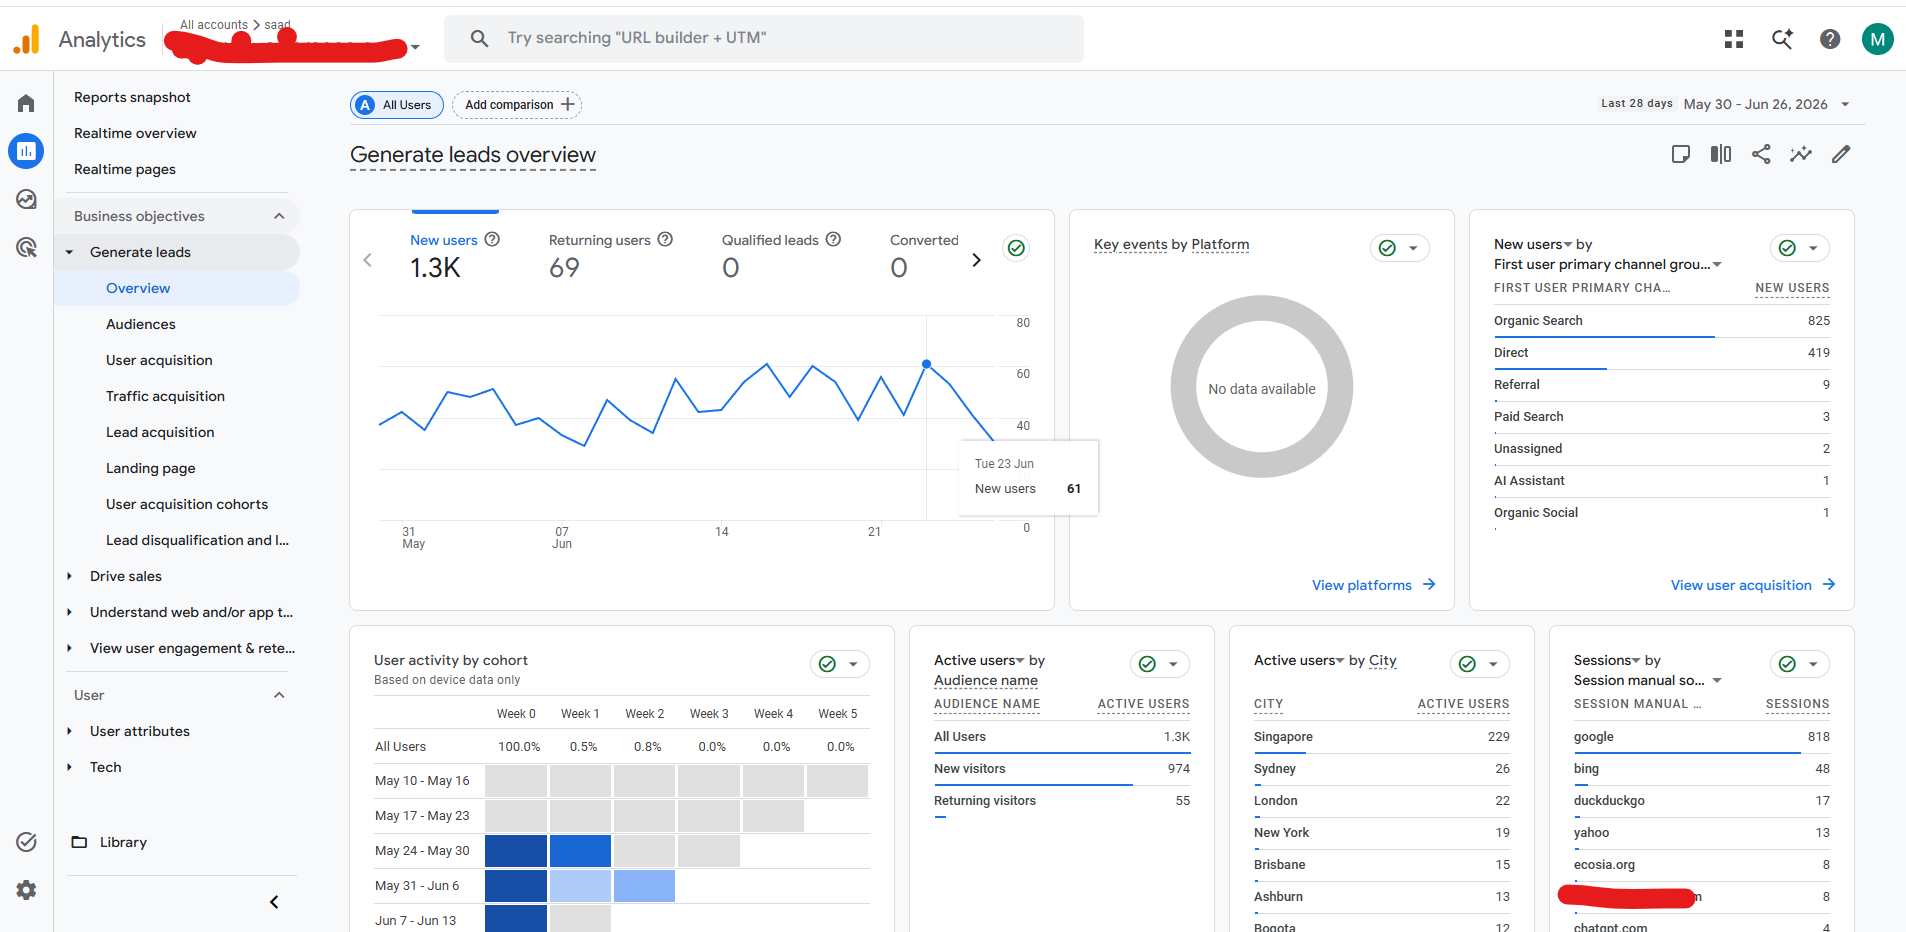
Use GA4 after Search Console because clicks are not the final SEO result. Search Console answers “who clicked from Google?” GA4 answers “what did organic users do after the click?”
Measure 7 GA4 SEO signals.
- Measure organic users by landing page.
- Measure organic sessions by source and medium.
- Measure engaged sessions by content type.
- Measure key events by landing page.
- Measure organic key-event rate.
- Measure revenue or lead value by organic channel.
- Measure assisted paths from organic search to conversion.
Example: a blog page receives 5,000 organic sessions and 40 lead key events. The page has a 0.8% organic lead key-event rate. Another page receives 1,000 organic sessions and 2 lead key events. The second page has a 0.2% organic lead key-event rate. The content team can improve the second page’s intent match, CTA placement, internal links, and offer relevance.
GA4 does not replace keyword data. GA4 connects SEO traffic to business behavior. Semrush and Ahrefs expand the market and competitor layer.
How does Semrush support keyword and competitor research?
Semrush supports keyword and competitor research by mapping search demand, ranking competitors, backlink signals, position tracking, site audits, and AI visibility across large SEO datasets.
Semrush is useful when a team needs market size, competitor overlap, keyword gaps, ranking trends, PPC context, backlink views, and content planning data. Semrush reports 142 geographic databases, 27.9 billion keywords, 808 million domains, 43 trillion backlinks, 500TB of raw website traffic data, and 239 million AI prompts in its 2026 database.
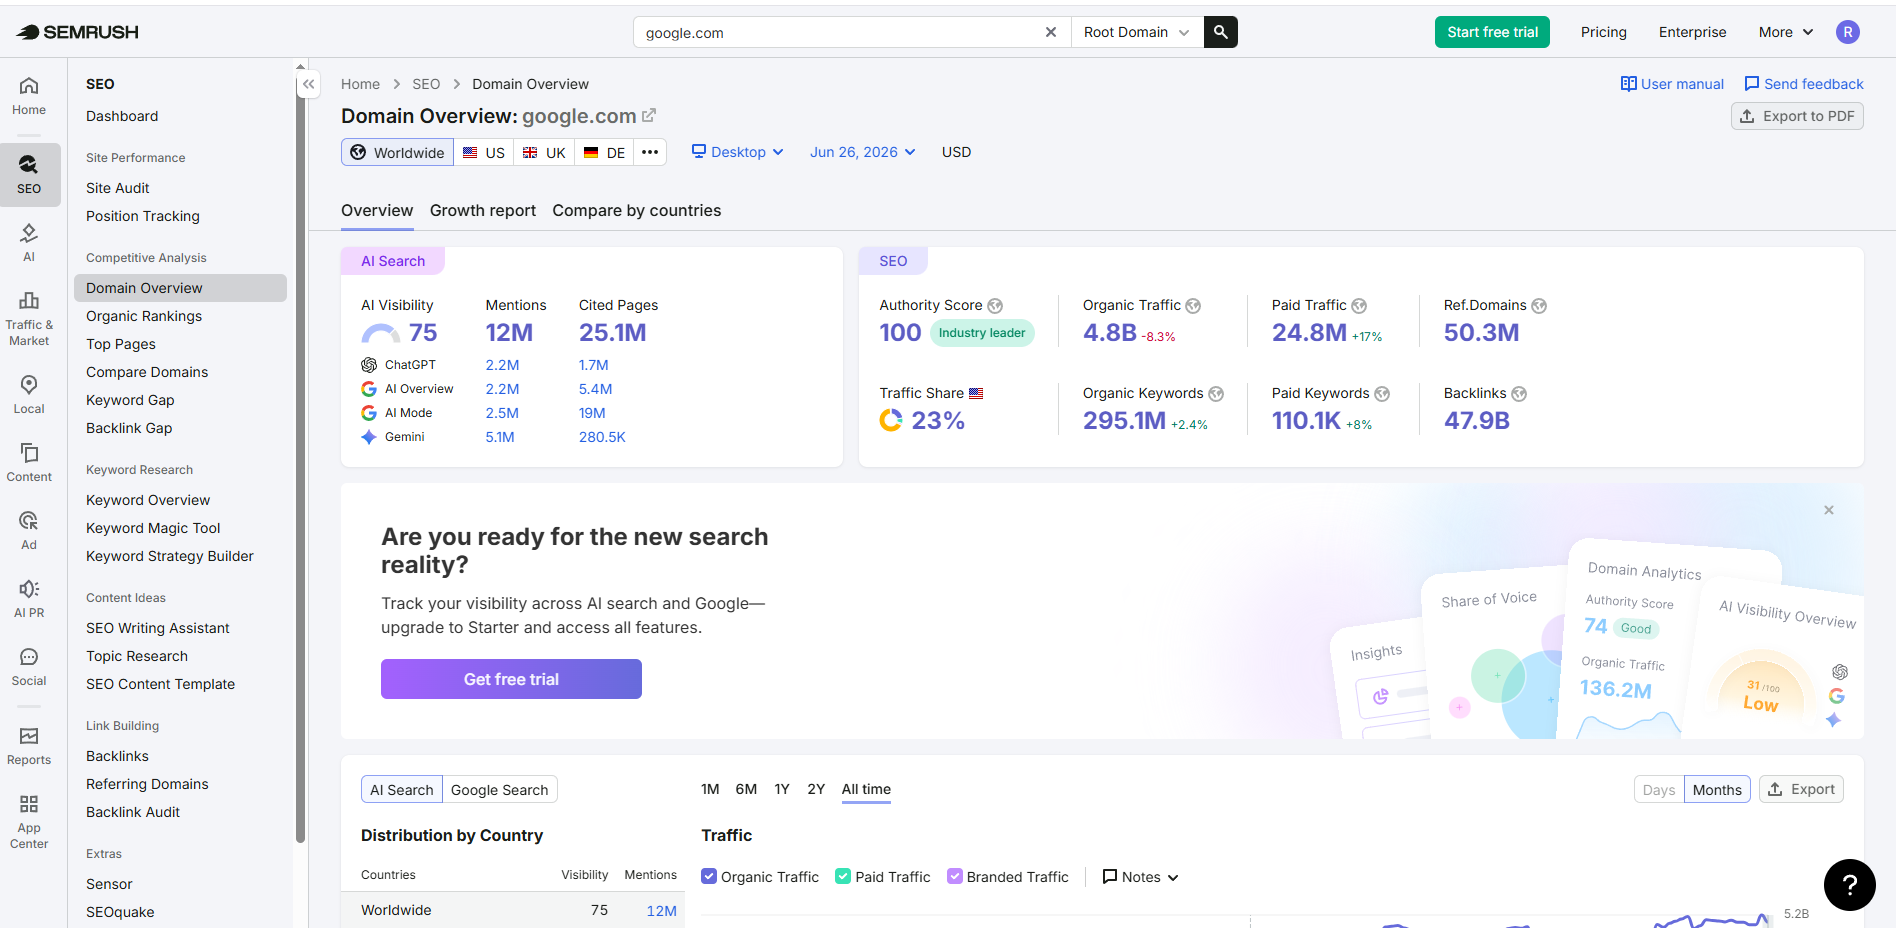
Use Semrush after GA4 because business value needs market expansion. GA4 shows which existing organic pages convert. Semrush helps find additional queries, competitors, content clusters, and ranking opportunities.
Measure 8 Semrush SEO signals.
- Measure keyword volume by country.
- Measure keyword difficulty by topic.
- Measure competitor ranking overlap.
- Measure keyword gaps across 3 to 5 competitor domains.
- Measure organic traffic estimates by competitor.
- Measure backlink gap and referring domains.
- Measure site audit health issues.
- Measure AI visibility and prompt-level brand presence.
Example: a competitor ranks for 220 semantic SEO keywords. Your site ranks for 80 of those keywords. Semrush shows a 140-keyword content gap. If 45 keywords have clear informational intent and moderate difficulty, the content plan can create or refresh 15 to 20 supporting pages across one topic cluster.
Semrush is strongest for market research and competitive SEO planning. Ahrefs is stronger when backlink depth, content gaps, and authority diagnostics are the main task.
How does Ahrefs strengthen backlink and content gap analysis?
Ahrefs strengthens SEO analysis by connecting backlinks, referring domains, keyword gaps, content discovery, rank tracking, and topic opportunities.
Ahrefs is a major SEO tool for backlink analysis and competitor content research. Ahrefs lists 110 billion keywords in its keyword database, 28.7 billion filtered keywords for keyword research, 16.9 billion pages in Content Explorer, rank tracking across 190+ countries, and site audits against 170+ on-page and technical SEO issues.
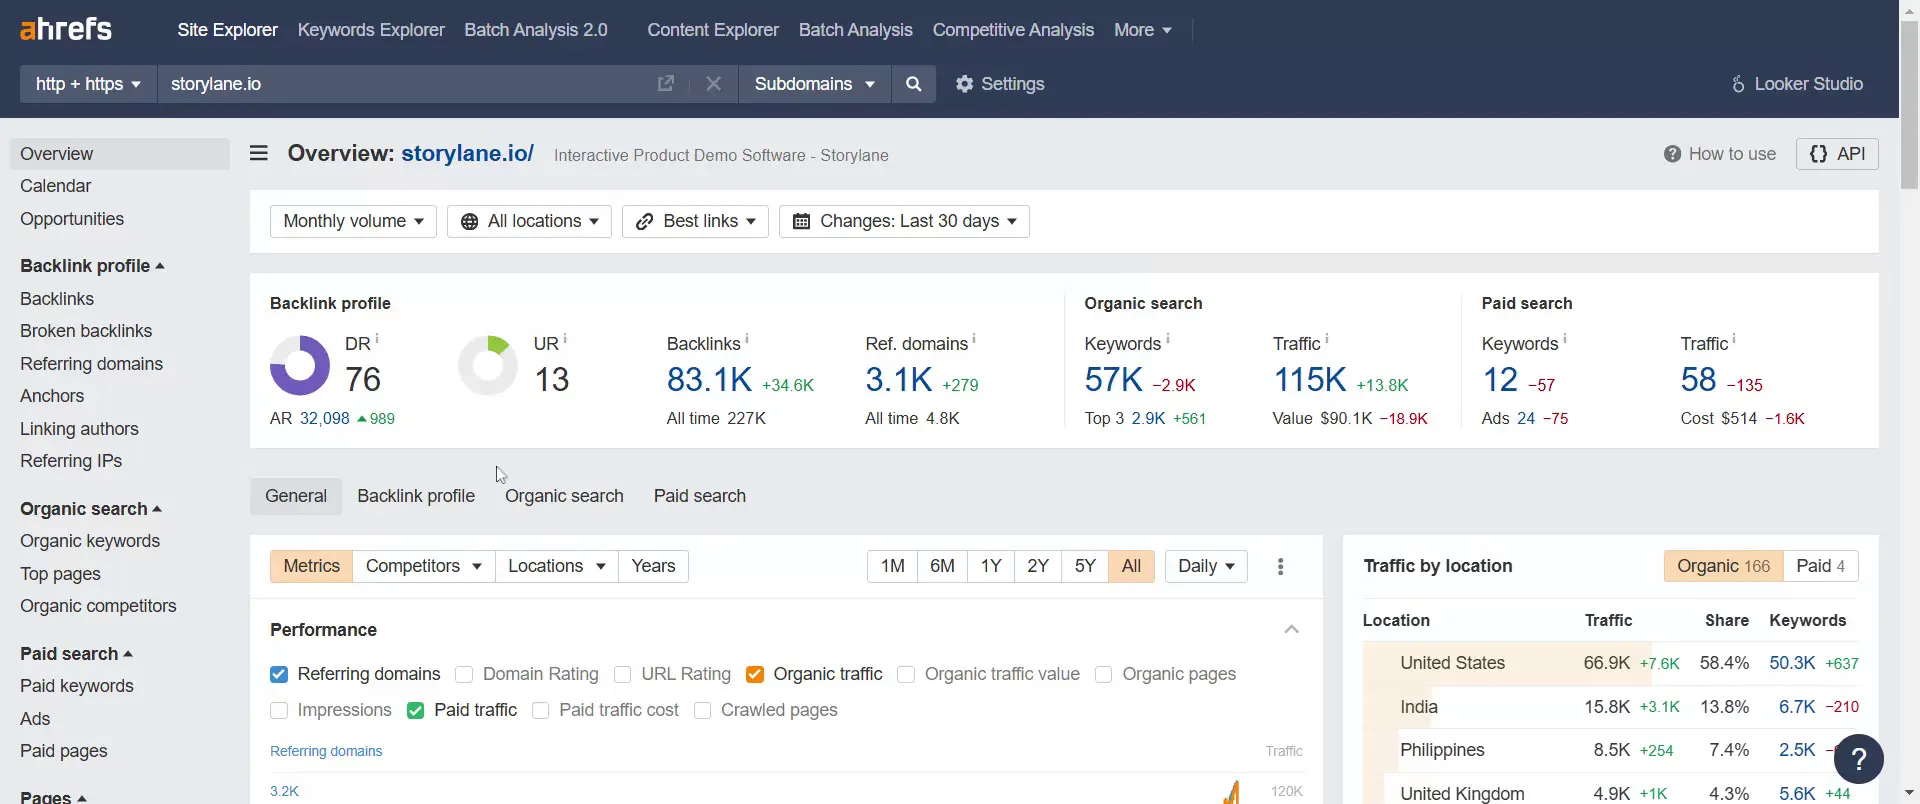
Use Ahrefs after Semrush because keyword opportunity often needs authority proof. A keyword gap is not always a content gap. Some gaps require backlinks, internal links, stronger topical coverage, better content freshness, or better search-intent alignment.
Measure 8 Ahrefs SEO signals.
- Measure referring domains by URL.
- Measure backlink quality and anchor text.
- Measure competitors’ linked pages.
- Measure link intersect opportunities.
- Measure content gaps by competing domains.
- Measure keyword ranking movements.
- Measure underlinked pages with traffic potential.
- Measure content topics with proven backlinks.
Example: your service page has 12 referring domains. The 3 ranking competitors average 55 referring domains. Ahrefs shows a 43-domain authority gap. The page may need digital PR, guest mentions, internal link strengthening, resource links, and stronger topical support before rankings move.
Ahrefs’ research found 96.55% of pages get zero Google traffic. That finding supports a clear SEO rule: content requires search demand, intent match, indexability, and authority. Ahrefs helps diagnose those 4 failure points.
How does Screaming Frog SEO Spider improve technical SEO?
Screaming Frog SEO Spider improves technical SEO by crawling websites like a search engine and exposing crawl, indexation, metadata, redirect, and internal-link issues.
Screaming Frog is a desktop crawler for Windows, macOS, and Linux. The free version crawls 500 URLs. The paid license removes the limit and adds advanced features. Screaming Frog identifies over 300 SEO issues, warnings, and opportunities.
Use Screaming Frog after competitor and authority research because ranking opportunities fail when crawl paths, canonicals, redirects, metadata, or internal links are broken. Technical SEO turns content plans into crawlable and indexable assets.
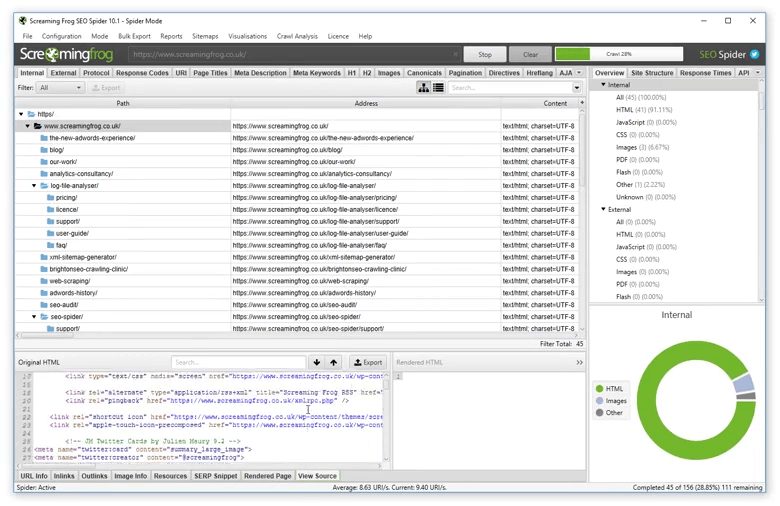
Measure 10 Screaming Frog SEO signals.
- Measure status codes, including 200, 301, 302, 404, and 500.
- Measure redirect chains and redirect loops.
- Measure missing, duplicate, short, and long title tags.
- Measure missing, duplicate, short, and long meta descriptions.
- Measure H1 and H2 structure.
- Measure canonical tags and canonical conflicts.
- Measure indexability and noindex rules.
- Measure crawl depth and internal link count.
- Measure image size and missing alt text.
- Measure structured data and hreflang issues.
Example: a 5,000-URL crawl finds 160 broken internal links, 240 duplicate titles, 75 canonical conflicts, and 300 pages deeper than 4 clicks from the homepage. Fixing these issues improves crawl access, internal relevance flow, and page clarity for search engines.
Screaming Frog is strongest for technical visibility. PageSpeed Insights extends that technical work into user experience and Core Web Vitals.
How does PageSpeed Insights improve SEO performance?
PageSpeed Insights improves SEO performance by measuring real-user page experience, Lighthouse diagnostics, Core Web Vitals, performance, accessibility, best practices, and SEO audits.
PageSpeed Insights uses Lighthouse for lab diagnostics. Lighthouse scores 90 or above as good, 50 to 89 as needs improvement, and below 50 as poor. Core Web Vitals measure 3 user-experience metrics: Largest Contentful Paint, Interaction to Next Paint, and Cumulative Layout Shift.
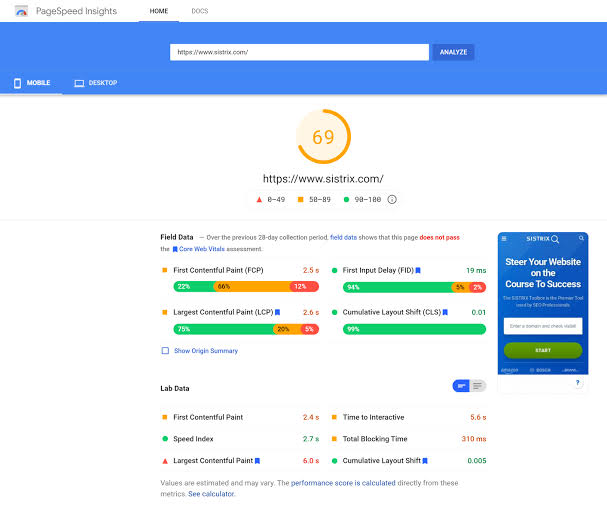
Use PageSpeed Insights after crawling because crawl health and page speed work together. A page can be indexable but slow. Slow pages reduce user satisfaction and weaken conversion performance.
Measure 7 PageSpeed Insights signals.
- Measure LCP for loading speed. A good LCP is 2.5 seconds or faster.
- Measure INP for responsiveness. A good INP is 200 milliseconds or faster.
- Measure CLS for visual stability. A good CLS is 0.1 or lower.
- Measure Lighthouse Performance score.
- Measure Accessibility score.
- Measure Best Practices score.
- Measure SEO score and page diagnostics.
Think with Google research found that page load time rising from 1 second to 10 seconds increases mobile bounce probability by 123%. The same research found that increasing page elements from 400 to 6,000 reduces conversion probability by 95%. These numbers show why page speed belongs in the SEO tool stack.
Example: a service page has LCP at 4.1 seconds, INP at 260 milliseconds, and CLS at 0.18. The technical team can compress the hero image, preload critical resources, reduce JavaScript tasks, reserve media dimensions, and improve server response. The target is LCP under 2.5 seconds, INP under 200 milliseconds, and CLS under 0.1.
PageSpeed Insights is strongest for experience diagnostics. Google Trends helps decide when content and updates need to go live.
How does Google Trends improve SEO timing?
Google Trends improves SEO timing by showing relative search interest, seasonal demand, regional demand, rising queries, and changing topic popularity.
Google Trends does not show absolute search volume. Google Trends normalizes interest on a 0–100 scale. A value of 100 means peak relative popularity for the selected time and location. A value of 50 means half the relative popularity of the peak.
Use Google Trends after speed diagnostics because technical readiness must meet demand timing. Content published too late misses the search curve. Content refreshed before demand spikes can earn impressions earlier.
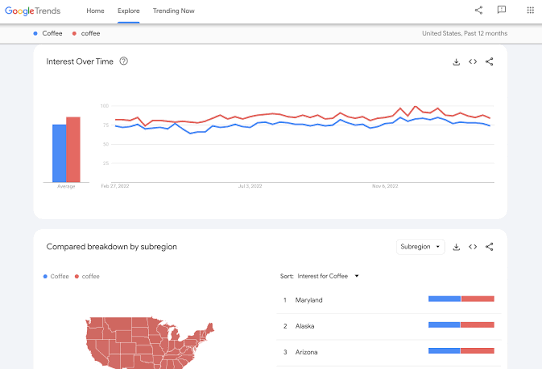
Measure 6 Google Trends SEO signals.
- Measure interest over time.
- Measure regional interest.
- Measure related topics.
- Measure related queries.
- Measure rising search terms.
- Measure seasonal peaks and declines.
Example: “tax software” rises from 18 in September to 100 in March in the United States. A content team can publish or refresh tax software guides 60 to 90 days before March. PubRadar can then compare whether competitors publish earlier, later, or more frequently in the same seasonal window.
Google Trends is strongest for timing and demand direction. Surfer SEO helps turn demand-backed topics into optimized page content.
How does Surfer SEO improve on-page content optimization?
Surfer SEO improves on-page content optimization by comparing a draft with top-ranking pages and measuring topical coverage, content structure, NLP terms, internal links, and Content Score.
Surfer’s Content Score is a 1–100 value that reflects content relevance and quality signals. In Content Editor, Surfer compares a draft with the top 20 pages ranking for the target query. Surfer also evaluates main keywords, partial keywords, NLP terms, headings, paragraphs, content length, images, alt text, metadata, and internal links.
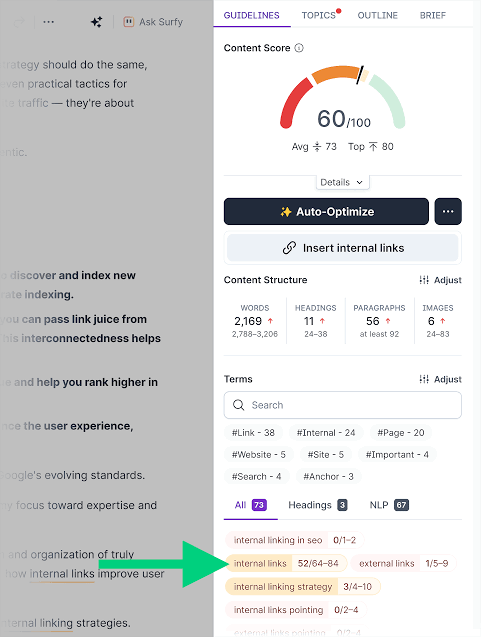
Use Surfer after Google Trends because demand alone does not create relevance. A page needs entity coverage, search-intent match, clear headings, answer-first structure, internal links, and semantically close terms.
Measure 8 Surfer SEO content signals.
- Measure Content Score.
- Measure missing NLP terms.
- Measure topical coverage.
- Measure title and H1 alignment.
- Measure heading structure.
- Measure content length against ranking competitors.
- Measure image and alt-text use.
- Measure internal linking opportunities.
Example: a draft has a Content Score of 48. Surfer shows 14 missing entity terms, 3 missing subtopics, weak H2 coverage, and 2 internal link opportunities. After adding missing definitions, examples, data points, headings, and internal links, the draft reaches a Content Score of 78. The page becomes more complete for users and easier for search systems to classify.
Surfer is strongest for content refinement. Looker Studio completes the stack by reporting how the full workflow performs.
How does Looker Studio report SEO performance?
Looker Studio reports SEO performance by turning SEO data sources into dashboards, scorecards, tables, charts, and client-ready reports.
Looker Studio connects to 1000+ data sets and supports many connector types. SEO teams use Looker Studio to combine Google Search Console, Google Analytics 4, Sheets, BigQuery, crawl exports, rank trackers, backlink tools, and PubRadar publication data.
Use Looker Studio last because reporting requires inputs from the whole SEO system. A useful SEO dashboard connects publication frequency, impressions, clicks, conversions, crawl errors, page speed, keyword movement, backlinks, and content optimization status.
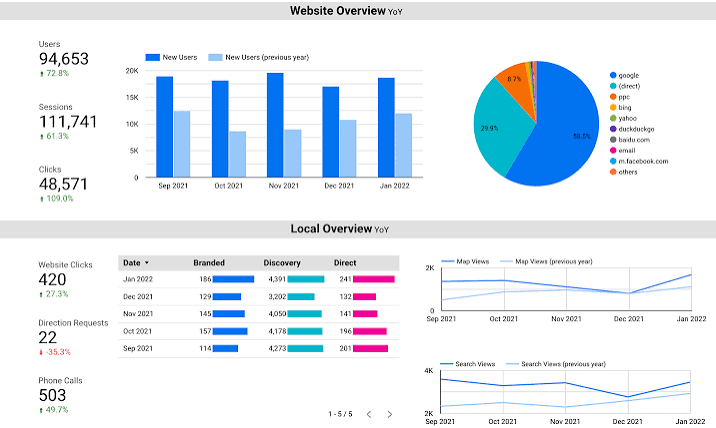
Measure 10 Looker Studio dashboard blocks.
- Report PubRadar pages published per week.
- Report competitor publication frequency.
- Report Google Search Console impressions and clicks.
- Report Google Search Console CTR and average position.
- Report GA4 organic sessions and key events.
- Report Semrush keyword gap movement.
- Report Ahrefs referring domains and content gaps.
- Report Screaming Frog technical errors.
- Report PageSpeed Core Web Vitals status.
- Report Surfer optimization progress by URL.
Example: an SEO agency dashboard shows 24 new pages published, 18 refreshed pages, 210,000 impressions, 8,400 clicks, 4.0% CTR, 320 organic leads, 140 fixed crawl errors, 22 improved Core Web Vitals URLs, and 38 new referring domains. This connects content operations with search performance and business outcomes.
Looker Studio is strongest for visibility across the full SEO workflow. The dashboard becomes a decision layer, not a screenshot layer.
Which SEO tool order creates the best workflow?
The best SEO tool order is PubRadar, Search Console, GA4, Semrush, Ahrefs, Screaming Frog, PageSpeed Insights, Google Trends, Surfer SEO, and Looker Studio.
This order follows a linear SEO workflow.
- Measure publication frequency with PubRadar.
- Validate search visibility with Google Search Console.
- Connect traffic to actions with Google Analytics 4.
- Expand keyword and competitor research with Semrush.
- Diagnose backlinks and content gaps with Ahrefs.
- Crawl technical issues with Screaming Frog SEO Spider.
- Improve experience with PageSpeed Insights.
- Time content with Google Trends.
- Optimize on-page relevance with Surfer SEO.
- Report the full system with Looker Studio.
This sequence prevents tool overlap. PubRadar measures content cadence. Search Console measures Google visibility. GA4 measures user value. Semrush measures the market. Ahrefs measures authority and gaps. Screaming Frog measures crawl health. PageSpeed measures experience. Google Trends measures timing. Surfer measures page relevance. Looker Studio measures the system.
How do these SEO tools work together?
These SEO tools work together by connecting publication, indexation, rankings, behavior, authority, speed, content relevance, and reporting into one SEO measurement loop.
| Tool Pair | Combined SEO Use | Decision Created |
|---|---|---|
| PubRadar + Google Trends | Content cadence and seasonal demand | Publish before demand peaks |
| PubRadar + Search Console | Published URLs and impression growth | Expand topics that earn visibility |
| Search Console + GA4 | Clicks and key events | Improve pages with traffic but weak conversions |
| Semrush + Ahrefs | Keyword gaps and authority gaps | Choose pages that need content, links, or both |
| Screaming Frog + PageSpeed Insights | Crawl health and page experience | Fix indexable but slow or unstable pages |
| Surfer + Search Console | Content relevance and query data | Refresh pages with impressions but low CTR |
| Looker Studio + All Tools | Unified SEO reporting | Show weekly and monthly SEO movement |
A complete SEO stack does not depend on one tool. The stack depends on data continuity. PubRadar starts the loop with publication frequency. Looker Studio closes the loop with cross-tool reporting.
Which SEO tools are free?
The main free SEO tools are Pubradar, Google Search Console, Google Analytics 4, Google Trends, PageSpeed Insights, and Looker Studio.
Free tools cover search performance, analytics, demand timing, speed diagnostics, and reporting. Paid tools add competitor databases, backlink indexes, large-scale crawling, content optimization, and workflow automation.
Use free tools first for baseline SEO measurement. Add paid tools when the site has enough pages, competitors, keywords, backlinks, and reporting demands.
Which SEO tools are best for agencies?
The best SEO tools for agencies are PubRadar, Google Search Console, GA4, Semrush, Ahrefs, Screaming Frog, PageSpeed Insights, Surfer SEO, Google Trends, and Looker Studio.
Agencies need repeatable systems. PubRadar supports content frequency tracking. Search Console and GA4 support performance evidence. Semrush and Ahrefs support market research. Screaming Frog and PageSpeed support technical delivery. Surfer supports content optimization. Looker Studio supports reporting.
A small agency can start with 5 tools: PubRadar, Search Console, GA4, Screaming Frog, and Looker Studio. A larger agency can add Semrush, Ahrefs, Surfer, PageSpeed workflows, and Google Trends planning.
Which SEO tool tracks competitor publication frequency?
PubRadar tracks competitor publication frequency by comparing content publishing cadence across your website and competitor websites.
Publication frequency tracking answers 5 questions.
- How many pages did each competitor publish this week?
- Which topic clusters received the most new content?
- Which competitor refreshed old pages?
- Which content formats are increasing?
- Which topics are missing from your content calendar?